 PRODRAFTSTATS™PRODRAFTSTATS™
Our Week 8 number is 12.19, and it comes with a receipt.
We project Tyler Warren for 12.19 full-PPR points in Week 8, 1.79 below his 13.98 season average. He is not alone. All five tight ends on our card sit under their own averages. This desk number is live, not sealed, and shows no range.
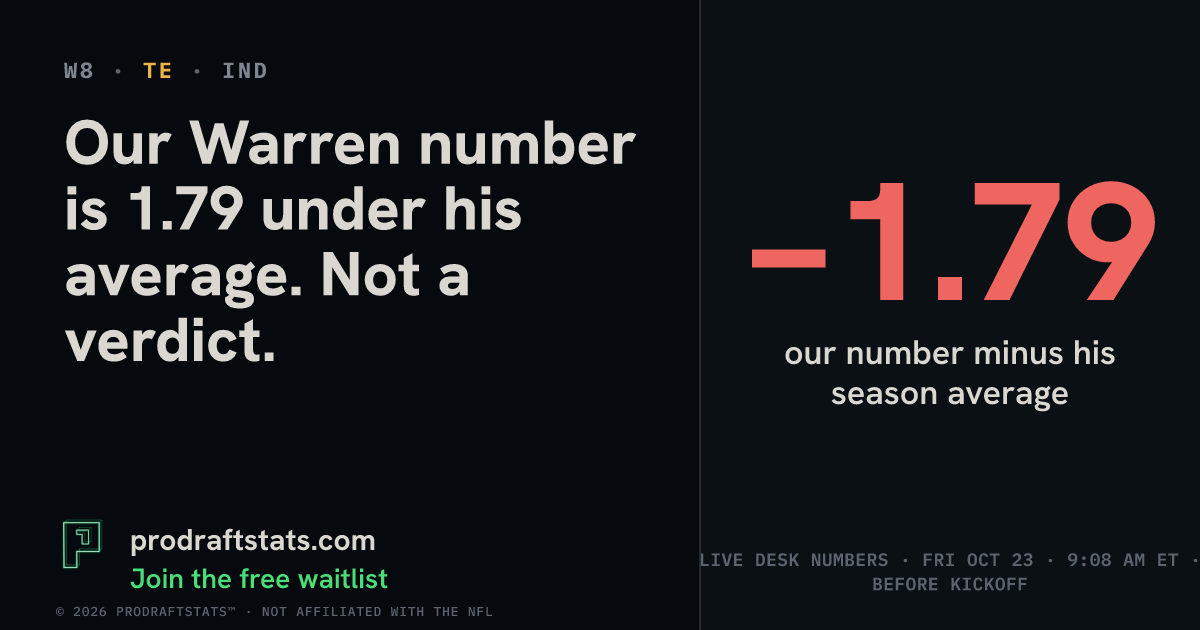
If Tyler Warren is in your lineup, you’ve been quoting his season average: 13.98 points per game. Our number for this week is 12.19, which is 1.79 lower.
That doesn’t make him a bad player. It means the average you keep quoting sits above our number for this week. We show no range, so one Sunday can land well above 12.19 or well below it, and what you do with that is up to you.
Here’s what to tell the league chat: he isn’t the only one. Every tight end on our card sits under his own season average, and Warren’s gap is the narrowest of the five, though Travis Kelce’s is nearly identical (1.82).
Who’s furthest under? That’s the first thing the card shows, and the answer is bigger than you’d guess.
Here is the full Week 8 card, our number against each player’s season average (points per game this season, full-PPR):
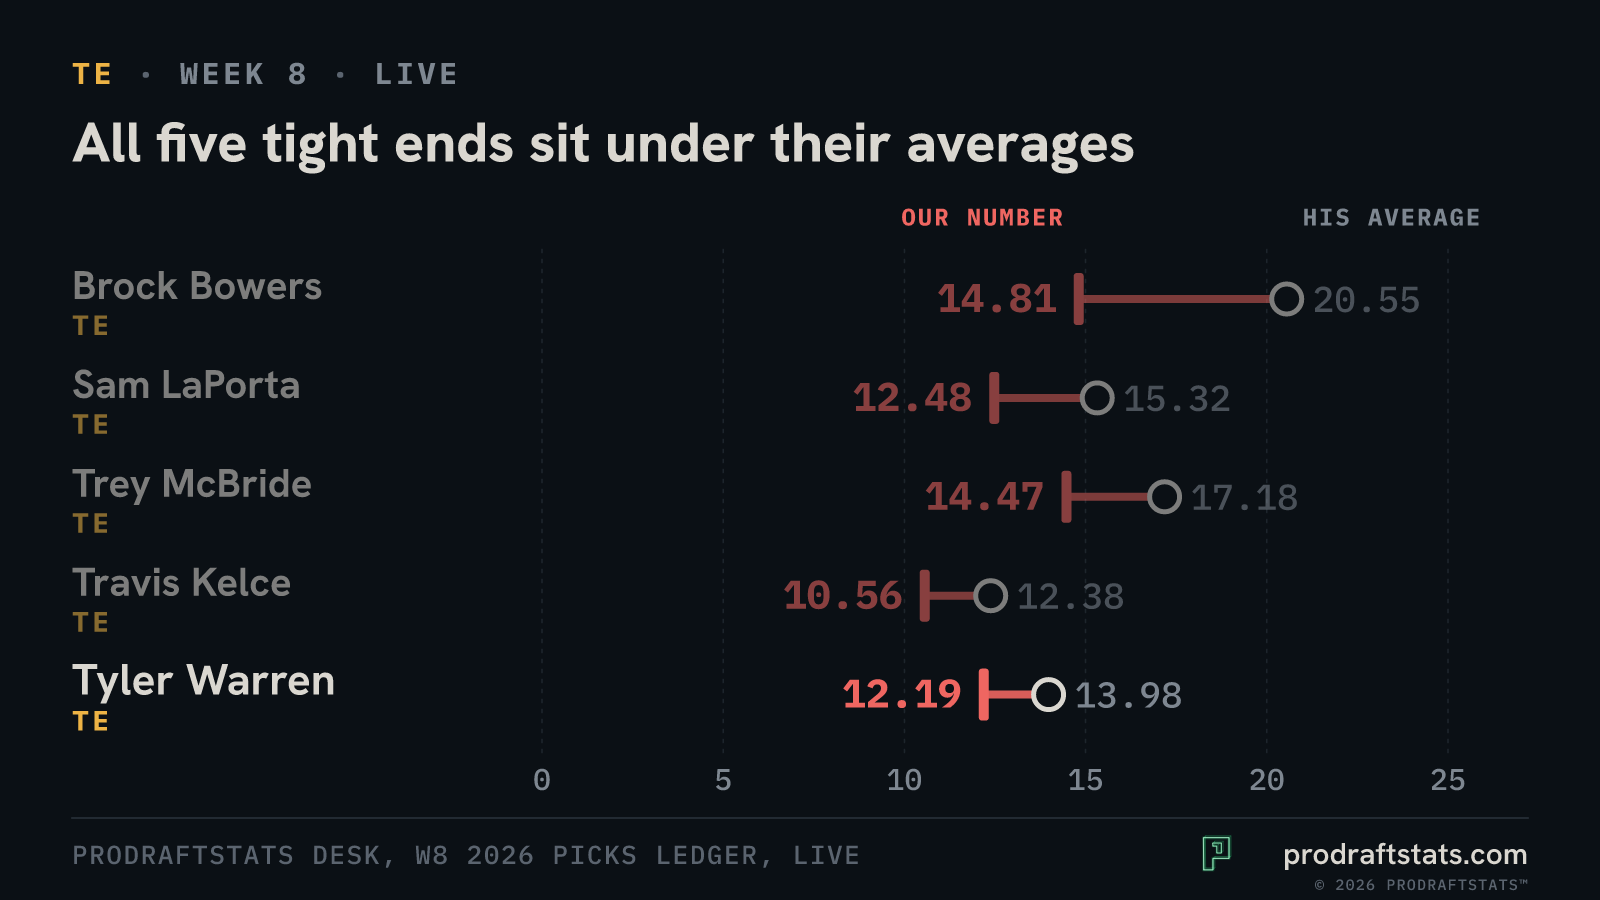
Brock Bowers has the widest gap at 5.74 (14.81 against 20.55). Sam LaPorta is 2.84 under (12.48 vs 15.32) and Trey McBride 2.71 under (14.47 vs 17.18). Travis Kelce is 1.82 under (10.56 vs 12.38). Warren’s 1.79 (12.19 vs 13.98) is the narrowest, but his 1.79 and Kelce’s 1.82 are effectively the same. These are point numbers with no interval shown, so the ordering should not be read as meaningful.
These gaps are not a comparison with ESPN, a betting market or ownership. Each one sets our number against that player’s own season so far.
But five out of five under the average raises an obvious question: why would that happen? We have not measured it, so we won’t claim one cause for all five.
That arithmetic raises a fair question: has his number been moving? Here is what the desk has written down.
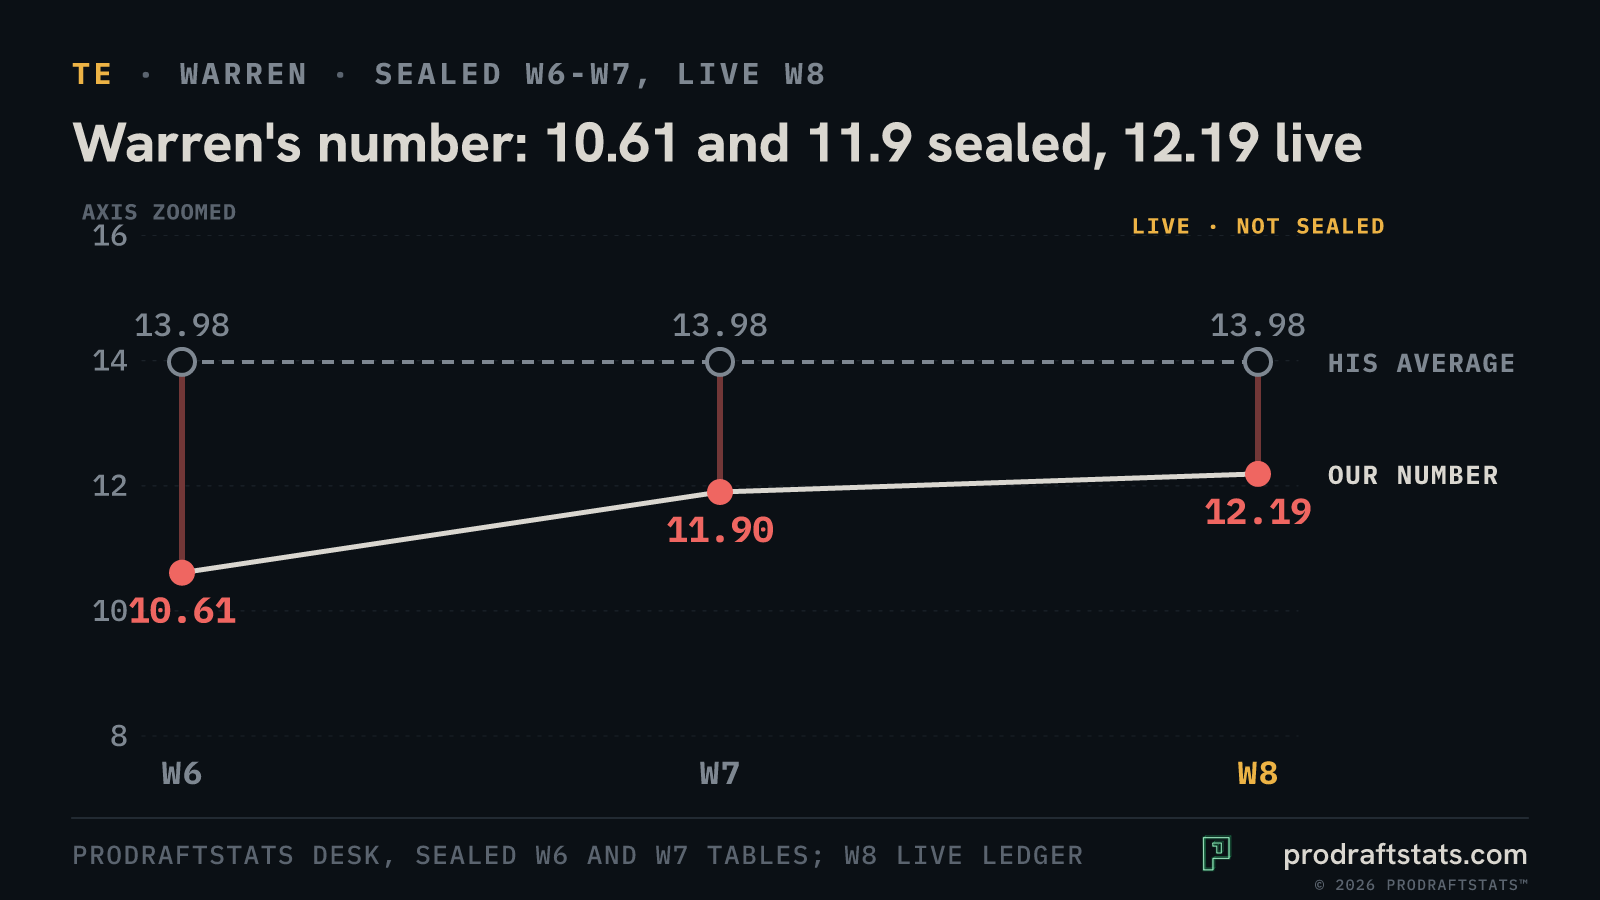
On our sealed tables, he was at 10.61 in Week 6 (gap of 3.37 under his 13.98) and 11.9 in Week 7 (gap of 2.08). The Week 8 number is live and not sealed, so it is not directly comparable to the two sealed ones. It is 12.19, a gap of 1.79. The TE card history shows different numbers from the sealed tables: 10.57 for Week 7, against the sealed 11.9, and 10.2 for Week 5 against a 13.13 average. We have not established why they differ, and we score only the sealed copy.
Three points from two kinds of table are not a trend. The data shows the number moving. It does not show why, so we won’t guess.
Here is the catch for a manager. A few weeks of box scores start to feel like a player’s true level, so any number below it feels like an instruction. That is anchoring, helped along by the pull of small samples.
Our numbers don’t say that. In the sealed Week 7 table, Warren was marked startable at 11.9, which was also under his 13.98 average. The desk’s start/sit tool also aims to maximise your chance of winning the matchup, not to maximise raw points.
Read 12.19 as our central number for the week, not a most-likely score. We show no range for it here, so he could land well above or below it. The right call depends on your matchup and your alternatives, and it is yours to make.
The ledger works on a separate question. Every pick is written down before kickoff and scored after the games against the frozen table, misses included. Our 12.19 is a number on that record, not a call on your lineup.
On rest of season, the honest answer is narrow. The data holds weekly numbers, not a rest-of-season projection.
The Week 8 numbers are live desk numbers, written Fri Oct 23 at 9:08 AM ET, before kickoff, and not yet sealed as of Saturday, Oct. 24; a sealed number may differ. The same applies to history: the card shows 10.57 for Week 7, while the sealed table shows 11.9, and we score only the sealed copy. No 2026 results are in this piece, and Week 7 outcomes are not part of it.
Send this to whoever in your league chat reads every projection under an average as bad news.
Source: ProDraftStats desk.
Our Week 8 number is 12.19 in full-PPR, against a 13.98 season average, a gap of 1.79. It is a live desk number, not sealed, and no range is shown, so a sealed number may differ.
Yes. All five tight ends on the Week 8 card sit under their own season averages. Brock Bowers has the widest gap at 5.74 (14.81 vs 20.55). Warren's 1.79 is effectively level with Travis Kelce's 1.82. No interval is shown, so the ordering shouldn't be read as meaningful.
Not by itself. 12.19 is a central number with no range shown, so he could land well above or below it. In the sealed Week 7 table he was marked startable at 11.9, also under his average. The right call depends on your matchup and alternatives, and it's yours to make.
ProDraftStats launches in 2027. Join the free waitlist.