 PRODRAFTSTATS™PRODRAFTSTATS™
Our numbers for Brock Bowers and Patrick Mahomes moved in opposite directions in one week, both written down before kickoff.
Brock Bowers had the biggest one-week rise in our numbers: 12.11 to 14.94 full-PPR points from Week 6 to Week 7, up 2.83. Patrick Mahomes fell 2.24, from 20.08 to 17.84. Both were set before kickoff. Week 7 is not yet scored.
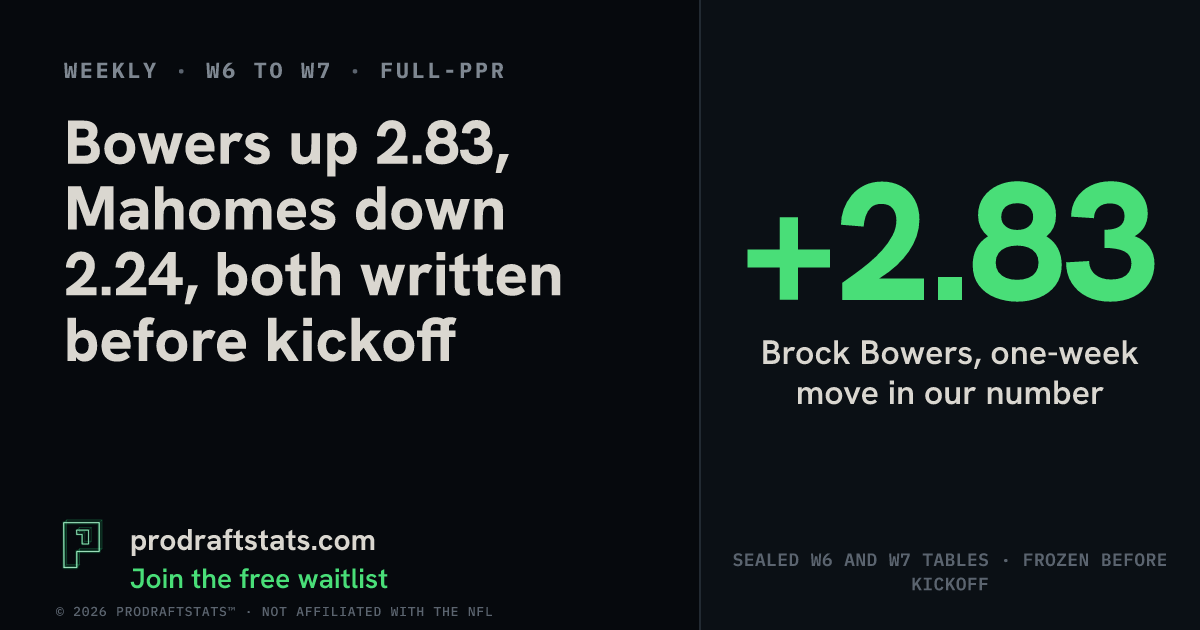
If Brock Bowers is on your roster, our number for him went up this week, from 12.11 to 14.94 full-PPR points. If Patrick Mahomes is on your roster, ours for him went the other way: 20.08 down to 17.84. If someone in your league chat calls one of them “cooked,” you can ask when they said it.
These moves were written down before kickoff, so nobody gets to quietly change them after the scores land. That is the point of a timestamp: it takes the loudest voice in the group out of the argument. A move is a price change, not a verdict, though. Nothing from Week 7 has been scored here, one week can land well above or below any number, and a number that drops can still be a high one.
We pulled the eight biggest risers and the eight biggest fallers from the week. One Las Vegas teammate of Bowers fell further than anyone else on the board, and the list leans toward one position you might not expect.
Bowers (LV, TE) moved furthest up, and no one on the board rose more. His Las Vegas teammate Dylan Laube, a running back, moved furthest down, from 6.93 to 4.30.
The eight biggest risers, as W6 to W7 projected points:
The eight biggest fallers are Laube (−2.63), Najee Harris (7.06 to 4.72, −2.34), Hunter Long (−2.24), Mahomes (−2.24), Davis Allen (−2.20), Kaleb Johnson (−2.10), Oscar Delp (−2.09) and Brevin Jordan (−2.05).
Three patterns show up in the table. On three teams, one player rose while a teammate fell: in Las Vegas, Bowers rose 2.83 while Laube fell 2.63; in Kansas City, Walker rose 2.39 while Mahomes fell 2.24; and in New York, Likely rose 2.35 while Harris fell 2.34. San Francisco is the exception, with McCaffrey and Kittle both moving up. Tight ends are common, at seven of the sixteen names. And a falling number can still be a high one. At 17.84, Mahomes still sits above six of the eight risers; only Walker (24.63) and McCaffrey (19.12) are higher.
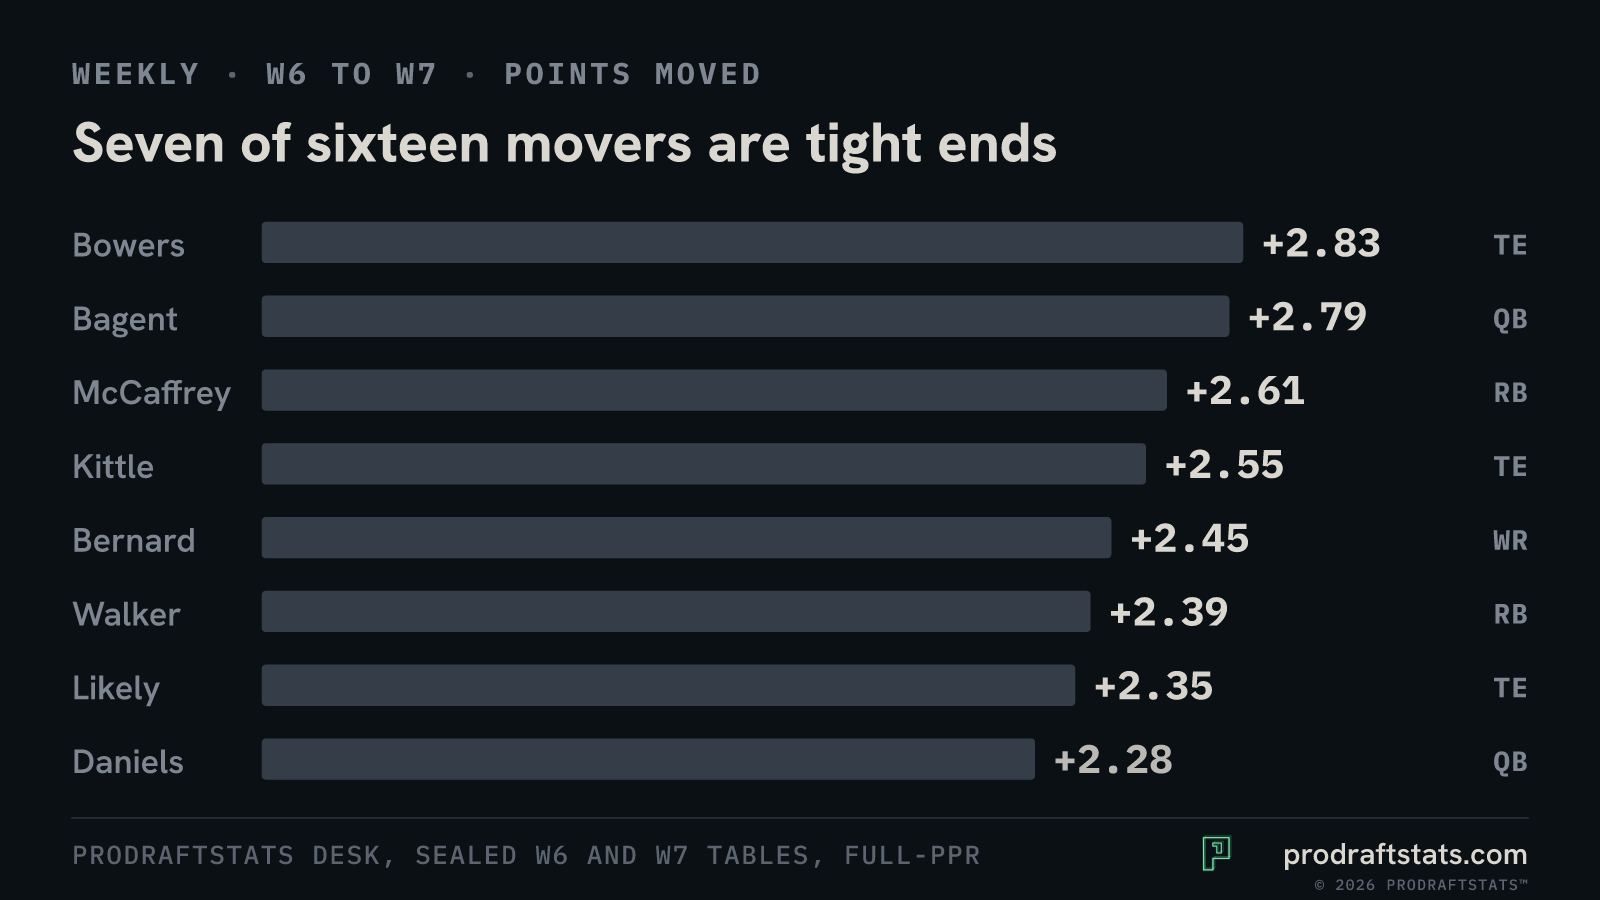
Seven tight ends out of sixteen raises the obvious question of why. We have not measured it, and we won’t guess.
That leads to a bigger limit: the table records how far each number moved, not why, and we won’t invent a reason it doesn’t contain.
Because of that, the useful question is how a fan reads a move. Psychologists describe anchoring: people start from the first number they saw and adjust too little. Someone who drafted Mahomes as a top quarterback may read 17.84 against a draft-day picture, not against last week’s 20.08. We have no crowd data, so we cannot say whether anyone is anchored on last week’s number.
A move is also not an instruction. A projection below a player’s own season average is the model disagreeing with his history. It is a price set against his own history, not a market price and not a sit call. A point projection is a central estimate for one week, and the real score can land well above or below it. What you do with the number is your call.
We can’t compare these moves with the crowd’s numbers this week. Week 7 results are not scored, so a +2.83 is a claim. These are weekly claims, not rest-of-season projections. One week’s move is one data point and shows no trend, and we have not tested whether consecutive moves in the same direction mean anything. Both weeks come from our sealed Week 6 and Week 7 tables, written before kickoff.
Send this to whoever in your league chat wants to see the dated numbers for both weeks.
Source: ProDraftStats desk.
Brock Bowers (LV, TE) rose the most, from 12.11 to 14.94 full-PPR points, a gain of 2.83. Tyson Bagent was next at +2.79. These are projection estimates written before kickoff.
Las Vegas running back Dylan Laube fell the most, from 6.93 to 4.30 (−2.63). Najee Harris dropped 2.34, and Patrick Mahomes fell 2.24, from 20.08 to 17.84.
Not on its own. A move is a price change, not a verdict or a sit call. At 17.84, Mahomes still sits above six of the eight biggest risers, and a weekly projection is only a central estimate. What you do with the number is your call.
ProDraftStats launches in 2027. Join the free waitlist.